環境資訊中心外電;姜唯 翻譯;林大利 審校;稿源:Carbon Brief
根據Carbon Brief對國際能源署(IEA)的分析顯示,再生能源未來五年內將快速成長,有機會追上全球燃煤電廠輸出量,兩者並列2024年全球電力結構的最大貢獻者。
本分析以IEA的「加速情境」為基礎。在此情境中,水力、風力、太陽能和生質能的總容量在未來五年內將增加60%以上。IEA預測,即使在「基本情境」下,再生能源裝置容量也可能增長近50%。
IEA執行董事比羅爾(Fatih Birol)博士在報告的前言中寫道:「由於成本下降,太陽能光伏(PV)和風力等技術已成為全球能源系統轉型的核心。兩者持續成長對於解決溫室氣體排放、減少空氣污染和擴大能源生產至關重要。」
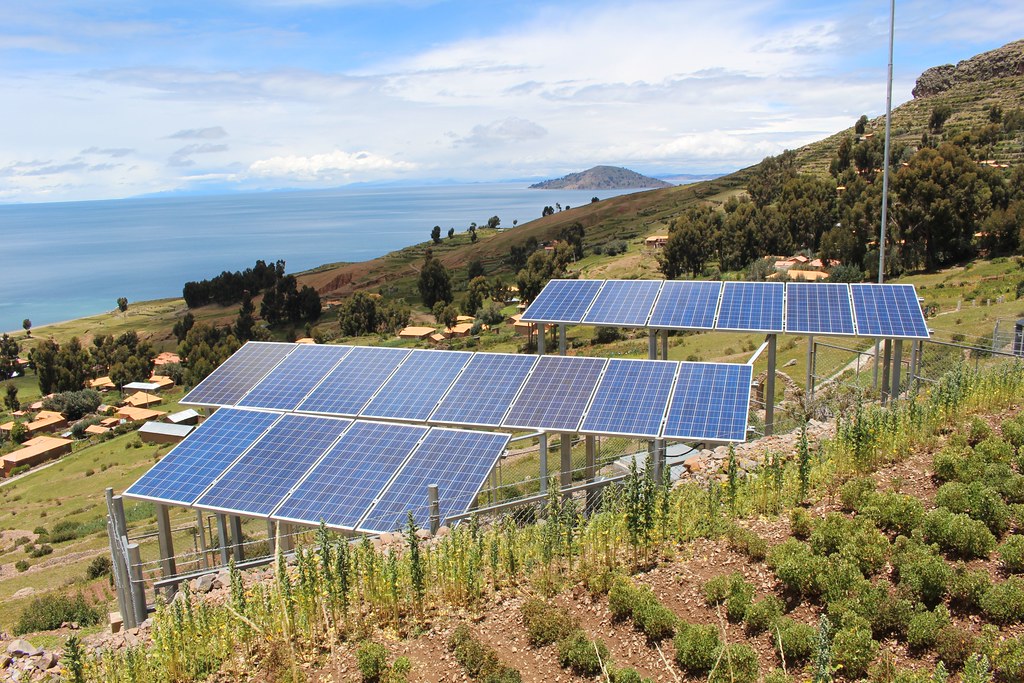
 地面太陽光電示意照片。來源: / 免費圖庫
IEA的基本情境再生能源預測過去一直低估了成長速度。不過,即使在加速情境下,IEA預測再生能源的電力成長仍將無法跟上整體需求的成長。
這表示化石燃料發電仍須成長,連帶電業的碳排也會增加,無法照著全球氣候目標迅速下降。
再生能源快速成長
在基本情境下,IEA新發表的2019年報告預測,到2024年的五年內,全球再生能源容量將增長近50%,如下圖所示(紅線)。
這表示全球水力、風力、太陽能和生質能容量將從2018年的2,501 GW(百萬瓩)增長到2024年的3,721 GW。這1,220 GW的增加相當於。

在基本情境下,風力和太陽能裝置容量將增加近一倍,佔所有再生能源增長的85%左右,其中水力的裝置容量佔十分之一,生質能裝置容量佔4%。
但值得注意的是,如上圖所示,IEA的基本情境歷來皆低估了成長速度。因此,IEA考量政策條件越來越有利以及成本下降的比預期更快,上修了預測結果。
在IEA追蹤的一系列競標案中,2014年太陽能成本為每一千度電(MWh)160美元,2023年啟用的設施則下降到平均每一千度17美元,陸域風電成本則從2014年的每一千度65美元下降到到2023年的30美元。
IEA在2019年預測加入了「加速情境」,如上圖虛線所示。在這種情境下,2024年再生能源容量將增加60%以上,達到4,036 GW,五年內將增加1,535 GW,相當於美國和日本目前的設備總和。
這並不是IEA首次對五年預測提出多重觀點。
例如,,IEA的基本情境就預測到2021年將增加約826GW的再生能源容量,而加速情境下將增加1,061GW。從2016年開始的加速情境預測與2019年的基本情境預測非常接近,在2016-2021年間增加了1,096GW。
成長數據向上修正
IEA預測報告涵蓋41個國家/地區,是針對世界各地市場、政策和電力系統前景進行的下到上詳盡分析。
IEA 表示,容量增長預計將集中在少數幾個地區,其中中國占40%、歐洲佔17%、美國占11%、印度佔9%。在IEA基本情境中,這些數字加起來佔全球成長的五分之四。
如前所述,再生能源裝置容量一直以來超過IEA基本情境下的預期增長。IEA 基本情境往往預測未來的年增量保持在相似的水平,而非每年持續成長。
下圖以紅色表示自2006年以來每年全球新增的再生能源容量,而每年的基本情境預測則以藍色表示。
與往年一樣,IEA再次提高了未來五年的成長預測,將其原本預期新增的容量再上修14%。去年,IEA2018年到2023年的五年將成長1,070GW。今年預測2019年到2024年的五年將成長1,220GW。
報告主要作者、IEA 再生能源資深分析師巴哈爾(Heymi Bahar)表示,此次向上修正的原因是政策更優惠和成本更低,兩個原因各佔約一半。
在政策方面,巴哈爾指出歐盟在歐洲進行一系列新的再生能源競標,這些競標是在各國開始加緊追趕及歐盟確定後發起的。在中國,電網擴張和市場改革減少了因為電網容量不足或供應過剩而浪費的發電量。
從上方圖中的紅線可以看出,2018年再生能源裝置容量成長平緩主要原因是中國的變化。這個停滯現象是每年新建的再生能源容量沒有超過過去的水準。
2018年期間,,提供最低價投標者固定的資金或容量 。
包括在內,各界普遍預期全球最大的再生能源市場的政策發生如此巨大的變化,將影響全球成長。然而,正如今年的資料所顯示,儘管中國發生小幅下跌,其他市場的強勁成長推動了全球趨勢發展,整體保持穩定成長,而非預期的下降。
第一名
再生能源擴充的速度已經,蠶食其市佔率,並改變了批售價格跨日、月和季的變化。
儘管如此,全球電力需求成長讓化石燃料發電量持續成長,增加了該產業對二氧化碳排放的貢獻。此外,煤炭仍穩坐其全球最大電力來源的地位。
比羅爾博士在新聞稿中表示:「再生能源已經是世界上第二大電力來源,但是如果我們要實現長遠的氣候、空氣品質和供電目標,仍然需要加快部署再生能源。」
自2010年以來,全球再生電力供給成長了60%,這個幅度可滿足半個美國經濟的電力需求。不過,這個漲幅僅能滿足全球電力需求成長的一半,另一半仍仰賴燃煤和天然氣發電(兩者又各自貢獻一半)。
IEA基本情境預測,未來五年,再生能源將滿足全球需求成長的三分之二。這表示仍需要燃煤和天然氣發電來補足成長的需求,只是作用有所減弱,而二氧化碳排放量仍然會成長。
由於大部分需求成長將由再生能源來滿足,它們在全球電力結構中佔比越來越大。在基本情境下,再生能源(紅線和圓點)比例將從現在的25%成長到2024年的30%,五年內成長5個百分點。煤炭(黑煤)是主要被排擠者,將下降至34%,但仍是全球電力的最大貢獻者。
<br />
由於整體需求的成長,雖然市佔下降,在IEA基本情境中,天然氣和燃煤發電在未來五年的輸出量和排放量仍將增加,天然氣尤其如此。
IEA報告中加速情境沒有相對應的數據,只知在該情境中,再生能源成長速度超過預期。但是Carbon Brief對IEA預測報告的分析顯示,再生能源有機會和燃煤並列全球最大電力來源。
如右上圖所示,到2024年,全球電力供給中再生能源比例將達到32%,而煤炭將降至類似的水準。但是即使在這樣的加速情境下,再生能源也只能滿足需求成長的80%,其餘由天然氣來補足。
再生能源加速發展可能讓2024年燃煤發電趨於平緩,甚至開始下降,但不足以達到能滿足所需的速度。
與一樣,IEA提出了三大問題,解決這些問題,才能實現加速情境,分別是政策和法規的不確定性、發展中國家的高投資風險,以及。
(IEA提及,在每個國家或地區的風力和太陽能部署曲線的早期階段,「整合問題」通常沒有預期的那麼嚴重。)
IEA指出,整合問題通常屬於「分散式」太陽能的風險,包括住宅屋頂,以及較大的商業和工業屋頂系統,這些系統往往成本較低。
IEA再生能源部門負責人弗蘭克爾(Paolo Frankl)在記者會上表示,由於這些系統的成本現在已經達到或低於大多數國家的零售電價,2040年成本甚至將進一步下降15-35%,分散式太陽能將出現爆炸性的成長。
比羅爾博士則表示,該產業具有驚人的潛力,但需要謹慎管理,以平衡分散式太陽能所有者、其他消費者和管理電網的公司的利益。
Analysis: Renewables could match coal power within 5 years, IEA reveals by Simon Evans
Renewable sources of electricity are set for rapid growth over the next five years, which could see them match the output of the world’s coal-fired power stations for the first time ever.
This would mean renewables matching coal as the joint-largest contributors to the global electricity mix in 2024, according to Carbon Brief analysis of new forecasts in the International Energy Agency (IEA) Renewables 2019 report.
The analysis is based on the IEA’s “accelerated case”, in which the combined capacity of hydro, wind, solar and biomass increases by more than 60% over the next five years. Even in its “base case”, renewable capacity is set to expand by nearly 50%, the IEA forecasts.
Dr Fatih Birol, IEA executive director, writes in a foreword to the report that “thanks to falling costs, technologies such as solar photovoltaics (PV) and wind are at the heart of transformations taking place across the global energy system”. He adds: “Their increasing deployment is crucial for efforts to tackle greenhouse gas emissions, reduce air pollution and expand energy access.”
The IEA’s base-case renewable forecasts have historically underestimated the pace of growth. Yet even in its accelerated case, the extra electricity from renewable sources will fail to keep up with rising overall demand, the IEA forecasts suggest.
This means that generation from fossil fuels would also have to increase, along with the electricity sector’s CO2 emissions, rather than falling rapidly as required to meet global climate goals.
Rapid growth
In its base case, the newly published 2019 IEA report forecasts that global renewable energy capacity will increase by close to 50% in the five years to 2024, as the chart below shows (red line).
This would mean global hydro, wind, solar and biomass capacity rising from 2,501 gigawatts (GW) in 2018 to 3,721GW in 2024. The increase of 1,220GW means the world would be building renewable capacity equal to the entire today, says the IEA.
<br />
Global renewable energy capacity, gigawatts, between 2010 and 2018 (black line) and IEA forecasts for five years ahead published in each year between 2013 and 2018 (shades of blue). Forecasts for 2019 are shown in red (base case) and dashed-red lines (accelerated case). Source: IEA Renewables 2019 report and previous iterations. Chart by Carbon Brief using .
Within the base case total, wind and solar capacity would nearly double, contributing around 85% of the increase for all renewables, with hydro accounting for another tenth and bioenergy 4%.
It is worth noting, however, that the IEA’s base-case has historically underestimated the pace of growth, as the chart above shows. As a result, successive forecasts have been revised upwards in light of increasingly favourable policy conditions and faster-than-expected reductions in cost.
In a series of auctions tracked by the IEA, the cost of solar has fallen from $160 per megawatt hour (MWh) in 2014 to an average of $17/MWh for projects due to start operating in 2023, while for onshore wind the costs have fallen from $65/MWh in 2014 to $30/MWh for 2023.
The IEA has also included an “accelerated case” in its 2019 forecasts, shown with a dashed line in the chart, above. In this case, renewable capacity would increase by more than 60% to 4,036GW in 2024, adding 1,535GW in five years, equivalent to the current total fleets of the US and Japan.
This is not the first time that the IEA has hedged its view for the next five years.
, for example, the agency’s base case forecast some 826GW of renewable capacity being added by 2021, with an accelerated case adding 1,061GW. This accelerated case from 2016 aligns closely with the 2019 base case, which has 1,096GW being added during 2016-2021.
Bottom up
The IEA forecast is based on detailed bottom-up analysis of the market, policy and electricity system outlook in each of 41 individual countries and every world region.
Capacity growth is expected to be concentrated in just a handful of regions, the IEA says, with 40% in China, 17% in Europe, 11% in the US and 9% in India. Together, these account for four-fifths of the global increase in the IEA’s base case.
As already mentioned, renewable capacity has consistently oustripped the growth expected in the IEA base case, which has tended to suggest that annual additions will remain at a similar level into the future, rather than consistently rising year on year.
The amount of new renewable capacity built around the world, each year since 2006, is shown in red in the chart below, while successive base-case forecasts are shown in shades of blue.
<br />
Annual renewable energy capacity additions, gigawatts, between 2006 and 2018 (red line) and IEA forecasts for growth over five years published between 2013 and 2019 (shades of blue). A 2019 “accelerated case” is shown with a dashed red line. Source: IEA Renewables 2019 report and previous iterations. Chart by Carbon Brief using .
As in previous years, the IEA has once again raised its forecast growth over the next five years, adding 14% to the amount of new capacity that it expects to be built. Last year, it of 1,070GW over the five years to 2023. Now, it is forecasting 1,220GW in the five years to 2024.
Responding to a question from Carbon Brief, Heymi Bahar, IEA senior renewable energy analyst and a lead author of the report told a pre-publication press call that this upwards revision was due to a roughly 50/50 combination of more favourable policy and lower costs.
On the policy side, Bahar pointed to a series of additional renewables auctions in the EU, initiated as countries look to meet and as the bloc’s have been firmed up. In China, grid expansion and market reforms have reduced the amount of renewable electricity that is “curtailed” – generation that is wasted due to insufficient grid capacity or an excess of supply.
The flattening of renewable capacity growth during 2018, seen in the red line in the chart, above, was also largely down to changes in China. This stalling marked the when the amount of renewable capacity built each year failed to exceed that seen before.
During 2018, China started to away from support based on “feed-in tariffs” that pay renewables a fixed price for each unit of electricity generated and towards a system of competitive auctions awarding a fixed pot of money or capacity to the lowest bidders.
This seismic change in the policy landscape of the world’s largest market for renewable energy had been widely expected to dent global growth, including in . Yet as this year’s figures show, despite a small dip in China itself, the global picture was buoyed by strong growth in other markets, keeping growth steady overall, rather than the expected decline.
Number one
The pace of expansion in renewable capacity has already of fossil-fueled sources of electricity in many countries, eating into their market share and changing the way wholesale prices vary across days, months and seasons.
Nevertheless, the growth of global electricity demand has been such that generation from fossil-fuel sources has continued to rise, increasing the sector’s contribution to CO2 emissions. Moreover, coal has comfortably maintained its position as the world’s largest source of electricity.
IEA executive director Dr Birol says in a press release:
“Renewables are already the world’s second largest source of electricity, but their deployment still needs to accelerate if we are to achieve long-term climate, air quality and energy access goals.”
Since 2010, global supplies of renewable electricity have expanded by 60%, adding enough output to power half the US economy. Yet this growth was only sufficient to cover half of the increase in global electricity demand, with the other half coming from a roughly equal split of coal and gas.
Over the next five years, the IEA base case forecasts that renewables will meet a larger two-thirds share of the increase in global demand. This would mean a continuing, if somewhat diminished role for coal and gas in meeting rising demand, with extra CO2 emissions to match.
Since the majority of demand growth would be met by renewables, they would claim an increasingly large share of the global electricity mix. In the base case, renewables (red line and dots) would increase their share from 25% today to 30% in 2024, gaining five percentage points in five years. This would largely come at the expense of coal (black), which would drop to 34% of the mix, but would remain the biggest contributor to global electricity supplies.
<br />
Change in the share of global electricity generation accounted for by coal (black lines), renewables (red), gas (blue) and nuclear (purple) between 2018 and 2024. The IEA base case is shown on the left while Carbon Brief's estimate of the mix in the IEA accelerated case is on the right. Source: IEA Renewables 2019 report and Carbon Brief analysis. Chart by Carbon Brief using .
Given the increase in demand overall, gas in particular, but also coal, would see their output – and emissions – increasing over the next five years in the IEA base case, despite losing market share.
The IEA’s report does not include equivalent figures for its “accelerated case”, where renewables grow more quickly than expected. However, Carbon Brief analysis of the IEA’s capacity forecasts suggests it could mean renewables matching coal as the world’s joint-largest sources of electricity.
This is shown in the chart, above right, where the renewable share of global electricity supplies would reach 32% by 2024 and coal would fall to a similar level. But even in this accelerated case, renewables would meet only 80% of the increase in demand, with gas making up the remainder.
This accelerated case for renewables could mean coal output flattening or even starting to decline out to 2024, but not at the rate required to get onto a pathway compatible with .
As in , the IEA sets out three areas that would need to be addressed in order for the accelerated case to be realised. These are: policy and regulatory uncertainty; high investment risks in developing countries; and of variable renewables into existing grids.
(The IEA notes that in the early stages of wind and solar deployment curves in each country or region, “integration challenges are often not as serious as anticipated”.)
The integration issue is a particular concern for “distributed” solar, the IEA suggests. This includes residential rooftops, but also larger commercial and industrial rooftop systems, which tend to have lower costs, the IEA says.
Given costs for these systems are now at or below the price of retail electricity in most countries – with costs set to fall a further 15-35% by 204 – there is an “explosive cocktail” of ingredients is in place for a “boom” in distributed solar capacity, Paolo Frankl, head of the IEA’s renewable energy division told a pre-publication press call.
Dr Birol told the call that this sector had “breathtaking” potential, but would need to be carefully managed so as to balance the interests of distributed solar owners, other consumers and the companies that manage electricity grids.
※ 全文及圖片詳見:()
作者
如果有一件事是重要的,如果能為孩子實現一個願望,那就是人類與大自然和諧共存。
於特有生物研究保育中心服務,小鳥和棲地是主要的研究對象。是龜毛的讀者,認為龜毛是探索世界的美德。
本站聲明:網站內容來源於https://e-info.org.tw/,如有侵權,請聯繫我們,我們將及時處理
【其他文章推薦】
※噴霧洗滌塔實際應用案例分享
※示波器鮮為人知的使用技巧?
※客製專屬滑鼠墊、可愛造型L夾、L型資料夾、透明證件套、手提袋,專業印刷設計廠商!
※使用真空封口機常見問題?
※高價位跟低價位的示波器又有何差異?